Title
Create new category
Edit page index title
Edit category
Edit link
Monitoring Service
Infoworks monitoring service is a part of the Infoworks platform used to monitor the resource utilization of the system and application in the Infoworks edge node. The service collects different metrics like CPU usage, memory usage, disk usage and application status and displays graphs on the dashboard.
It provides both realtime and historic views of resource utilisation of the system and application.
This service also supports sending alerts and notifications via email or slack when a service or system alarm is raised. For example, you can set the service to send alerts when the disk is full or exceeds some threshold.
Configuring Monitoring Service
Ensure the monitoring service is configured before starting the service. Following are the steps to configure the monitoring service:
Navigate to the $IW_HOME/platform/iw_monitor/bin folder and set the following configurations in the conf.properties file:
- env: A unique name of the environment.
- edge_nodes: List of all Infoworks edge nodes that must be monitored. The default value is [localhost].
- server_host: IP of the machine where the monitoring server is running. The default value is [localhost].
- server_port: Monitoring server listen port on the machine. The default value is 3020.
- scrape_interval: The time between each server scrape (when server pulls data from exporters, etc). The default value is 15s.
- evaluation_interval: The time between each evaluation of server alerting rules. The default value is 15s.
- data_retention_period: The period for which the data will be retained. The defaults is 15d.
- iw_services_alert_period: Monitor period of Infoworks services before sending alarms, if any. The default value is 5m.
- alertmanager_host: IP of the machine where alertmanager is running. The default value is [localhost].
- alertmanager_port: Alert manager port on the machine. The default value is 3021.
- group_wait: The period until which the alert manager waits and buffers the alerts of the same group, before sending the alert notification. The default value is 1m.
- group_interval: The period until which the alert manager waits and buffers the alerts that has been added to a group that contains already fired alerts, before sending the alert notification. The default value is 30m.
- repeat_interval: The period until which the alert manager waits before resending an alert that has already been sent. The default value is 30m.
- alert_channels: Channels to send alerts. The available channels are slack, email and webhooks.
- slack_channel: Slack channel to send notifications.
- slack_api_url: Slack webhook url. For example, https://hooks.slack.com/services/DFDFDSF/KJJKSDKSJ/dfkjdfkjdgrjdnfajkdsnjf.
- email_to: List of email IDs to send alerts and notifications.
- email_from: Email ID of the sender.
- email_host: Email ID of the host.
- email_password: Email password.
- webhook_url: Webhook URL to receive alerts and notification.
- grafana_port: Grafana monitoring service dashboard port on the machine. The default value is 3022.
- node_port: System metrics exporter port on the localhost. The default value is 3023.
- process_port: Process metrics exporter port on the localhost. The default value is 3024.
- log_level: Log level for logging all the monitoring components. The default value is info.
Starting and Stopping Monitoring Service
Following are the commands to manage the starting and stopping of monitoring service from the Infoworks service scripts:
- To start the monitoring service, navigate to the $ IW_HOME/bin folder and run the following command:
sh start.sh monitor - To stop the monitoring service, navigate to the $ IW_HOME/bin folder and run the following command:
sh stop.sh monitor - To get the status of the monitoring service, navigate to the $IW_HOME/bin folder and run the following command:
sh status.sh
Accessing Monitor Dashboard
Monitoring service dashboard can be accessed from http://<Monitoring_Service_Host>:<Monitoring_Service_Port>
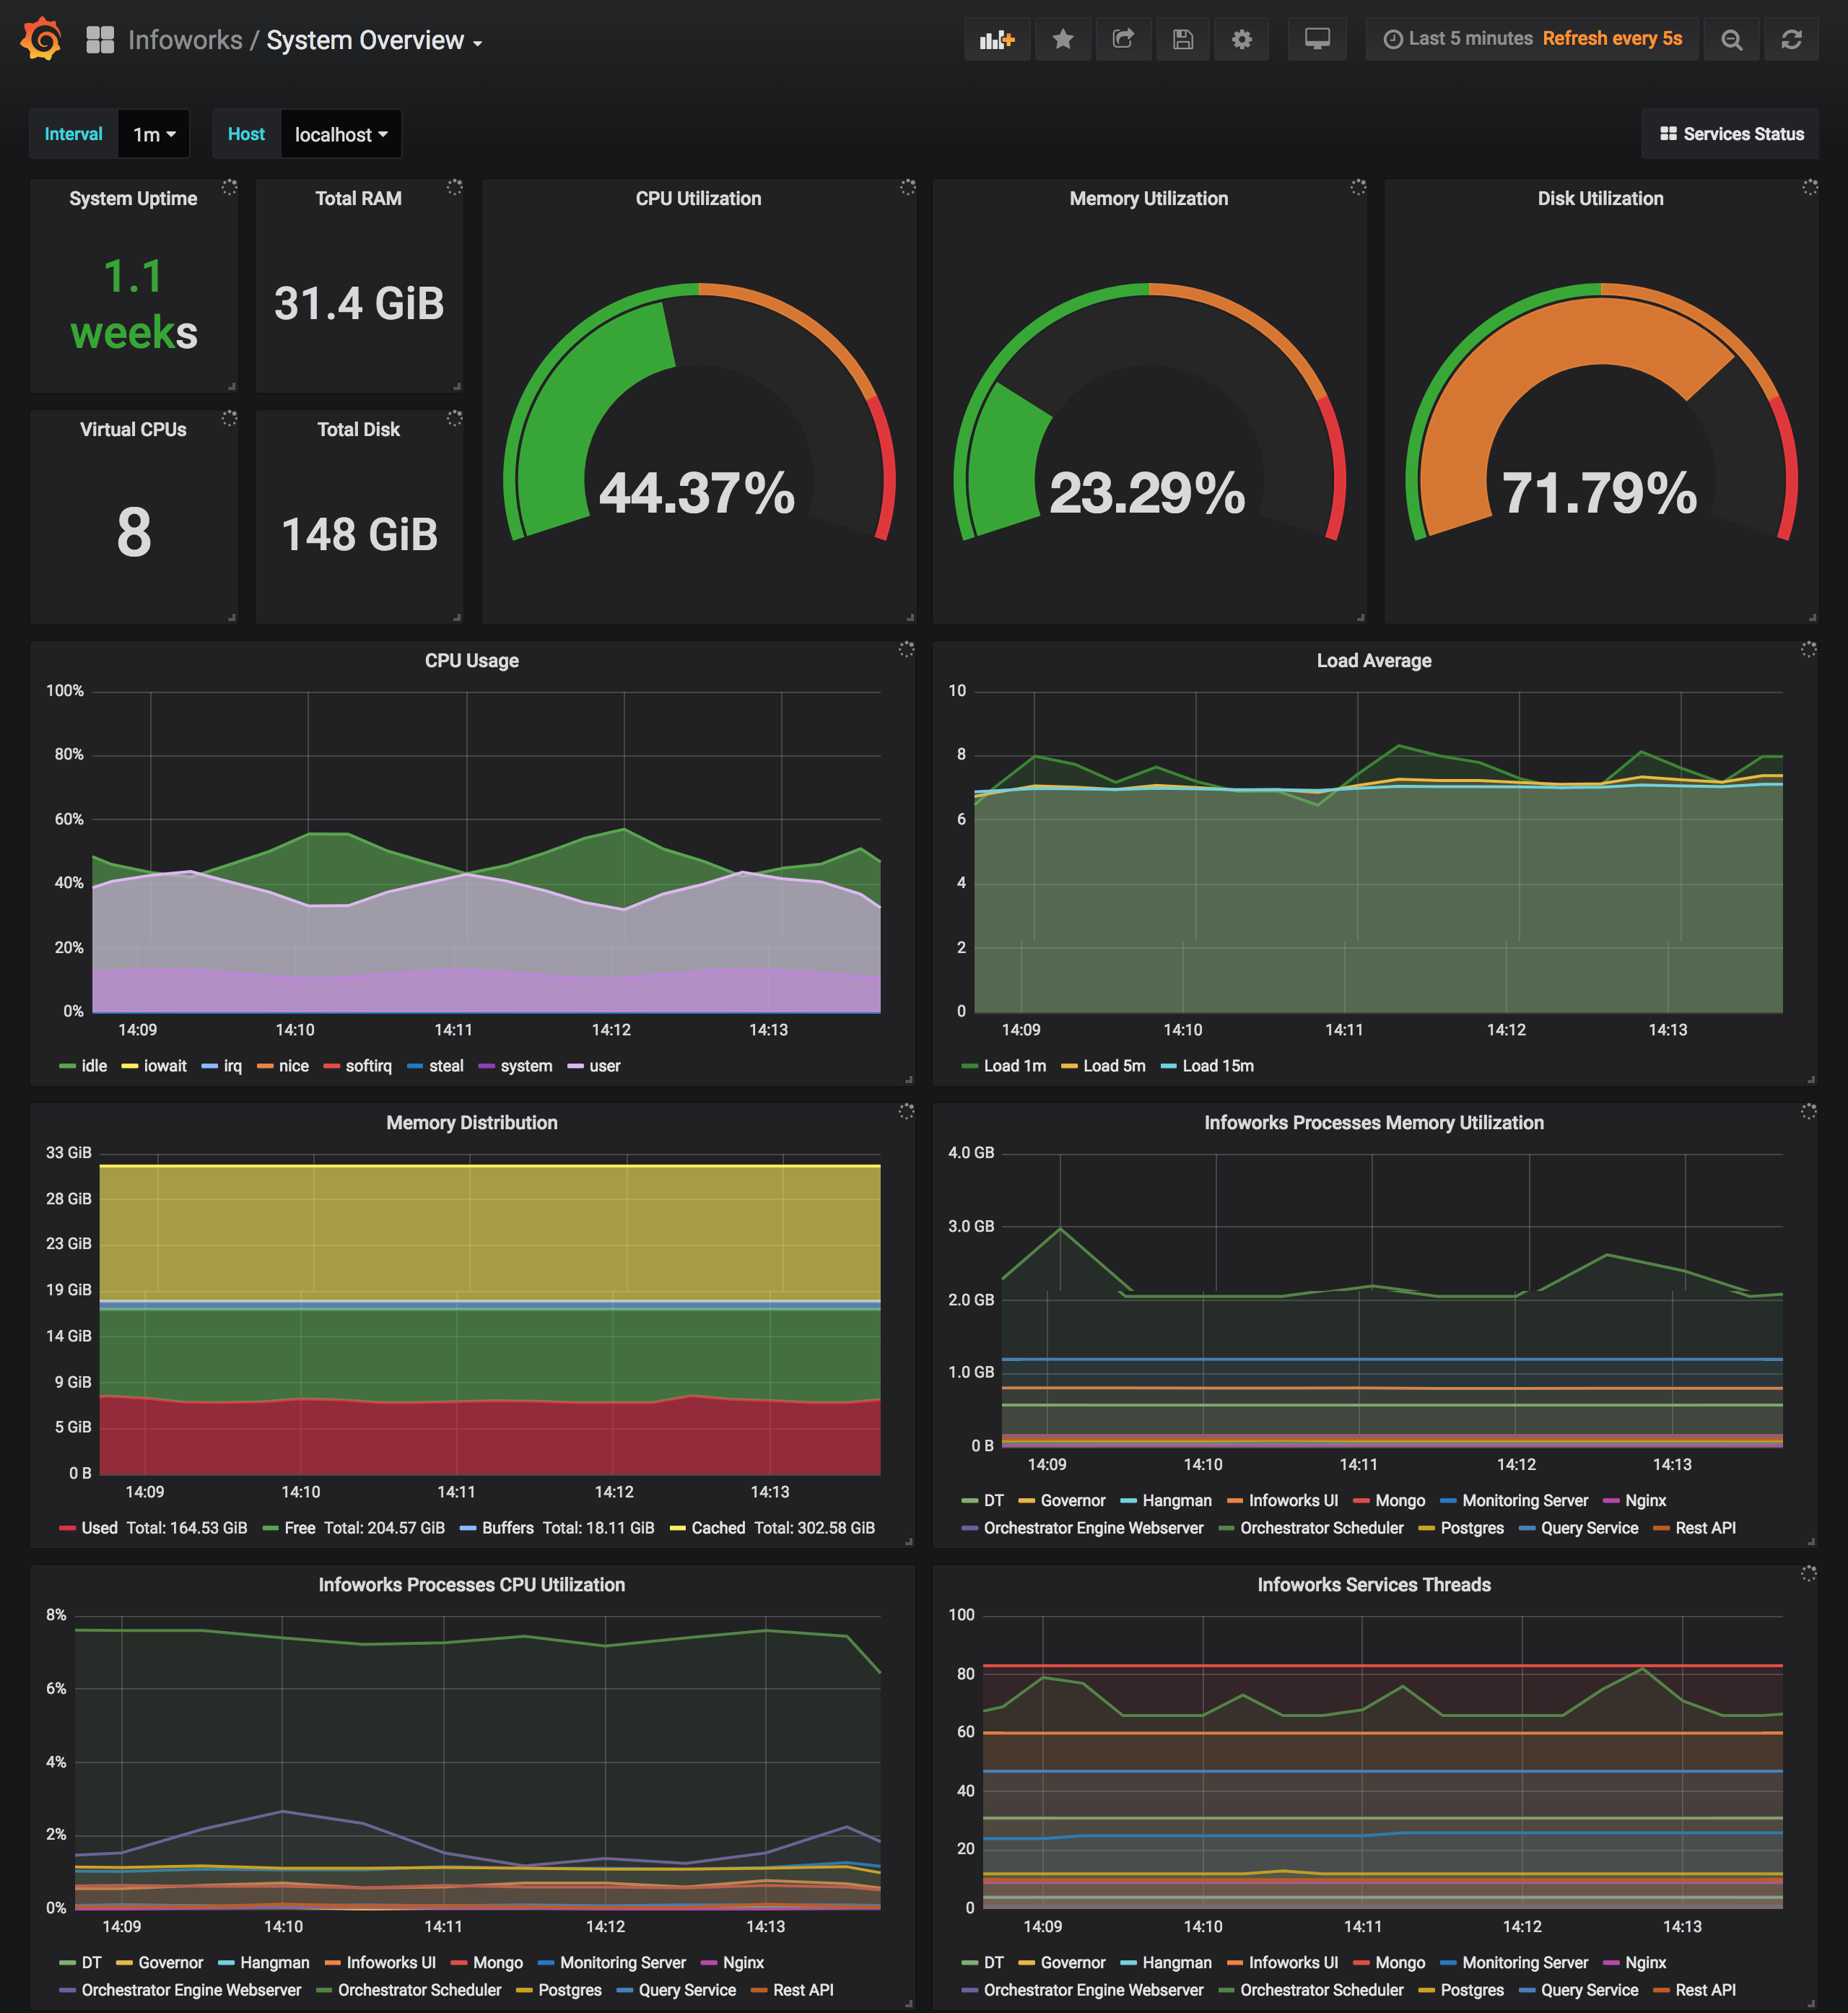
System and Process Overview Dashboard
This dashboard displays the system and Infoworks service resource utilization metrics.

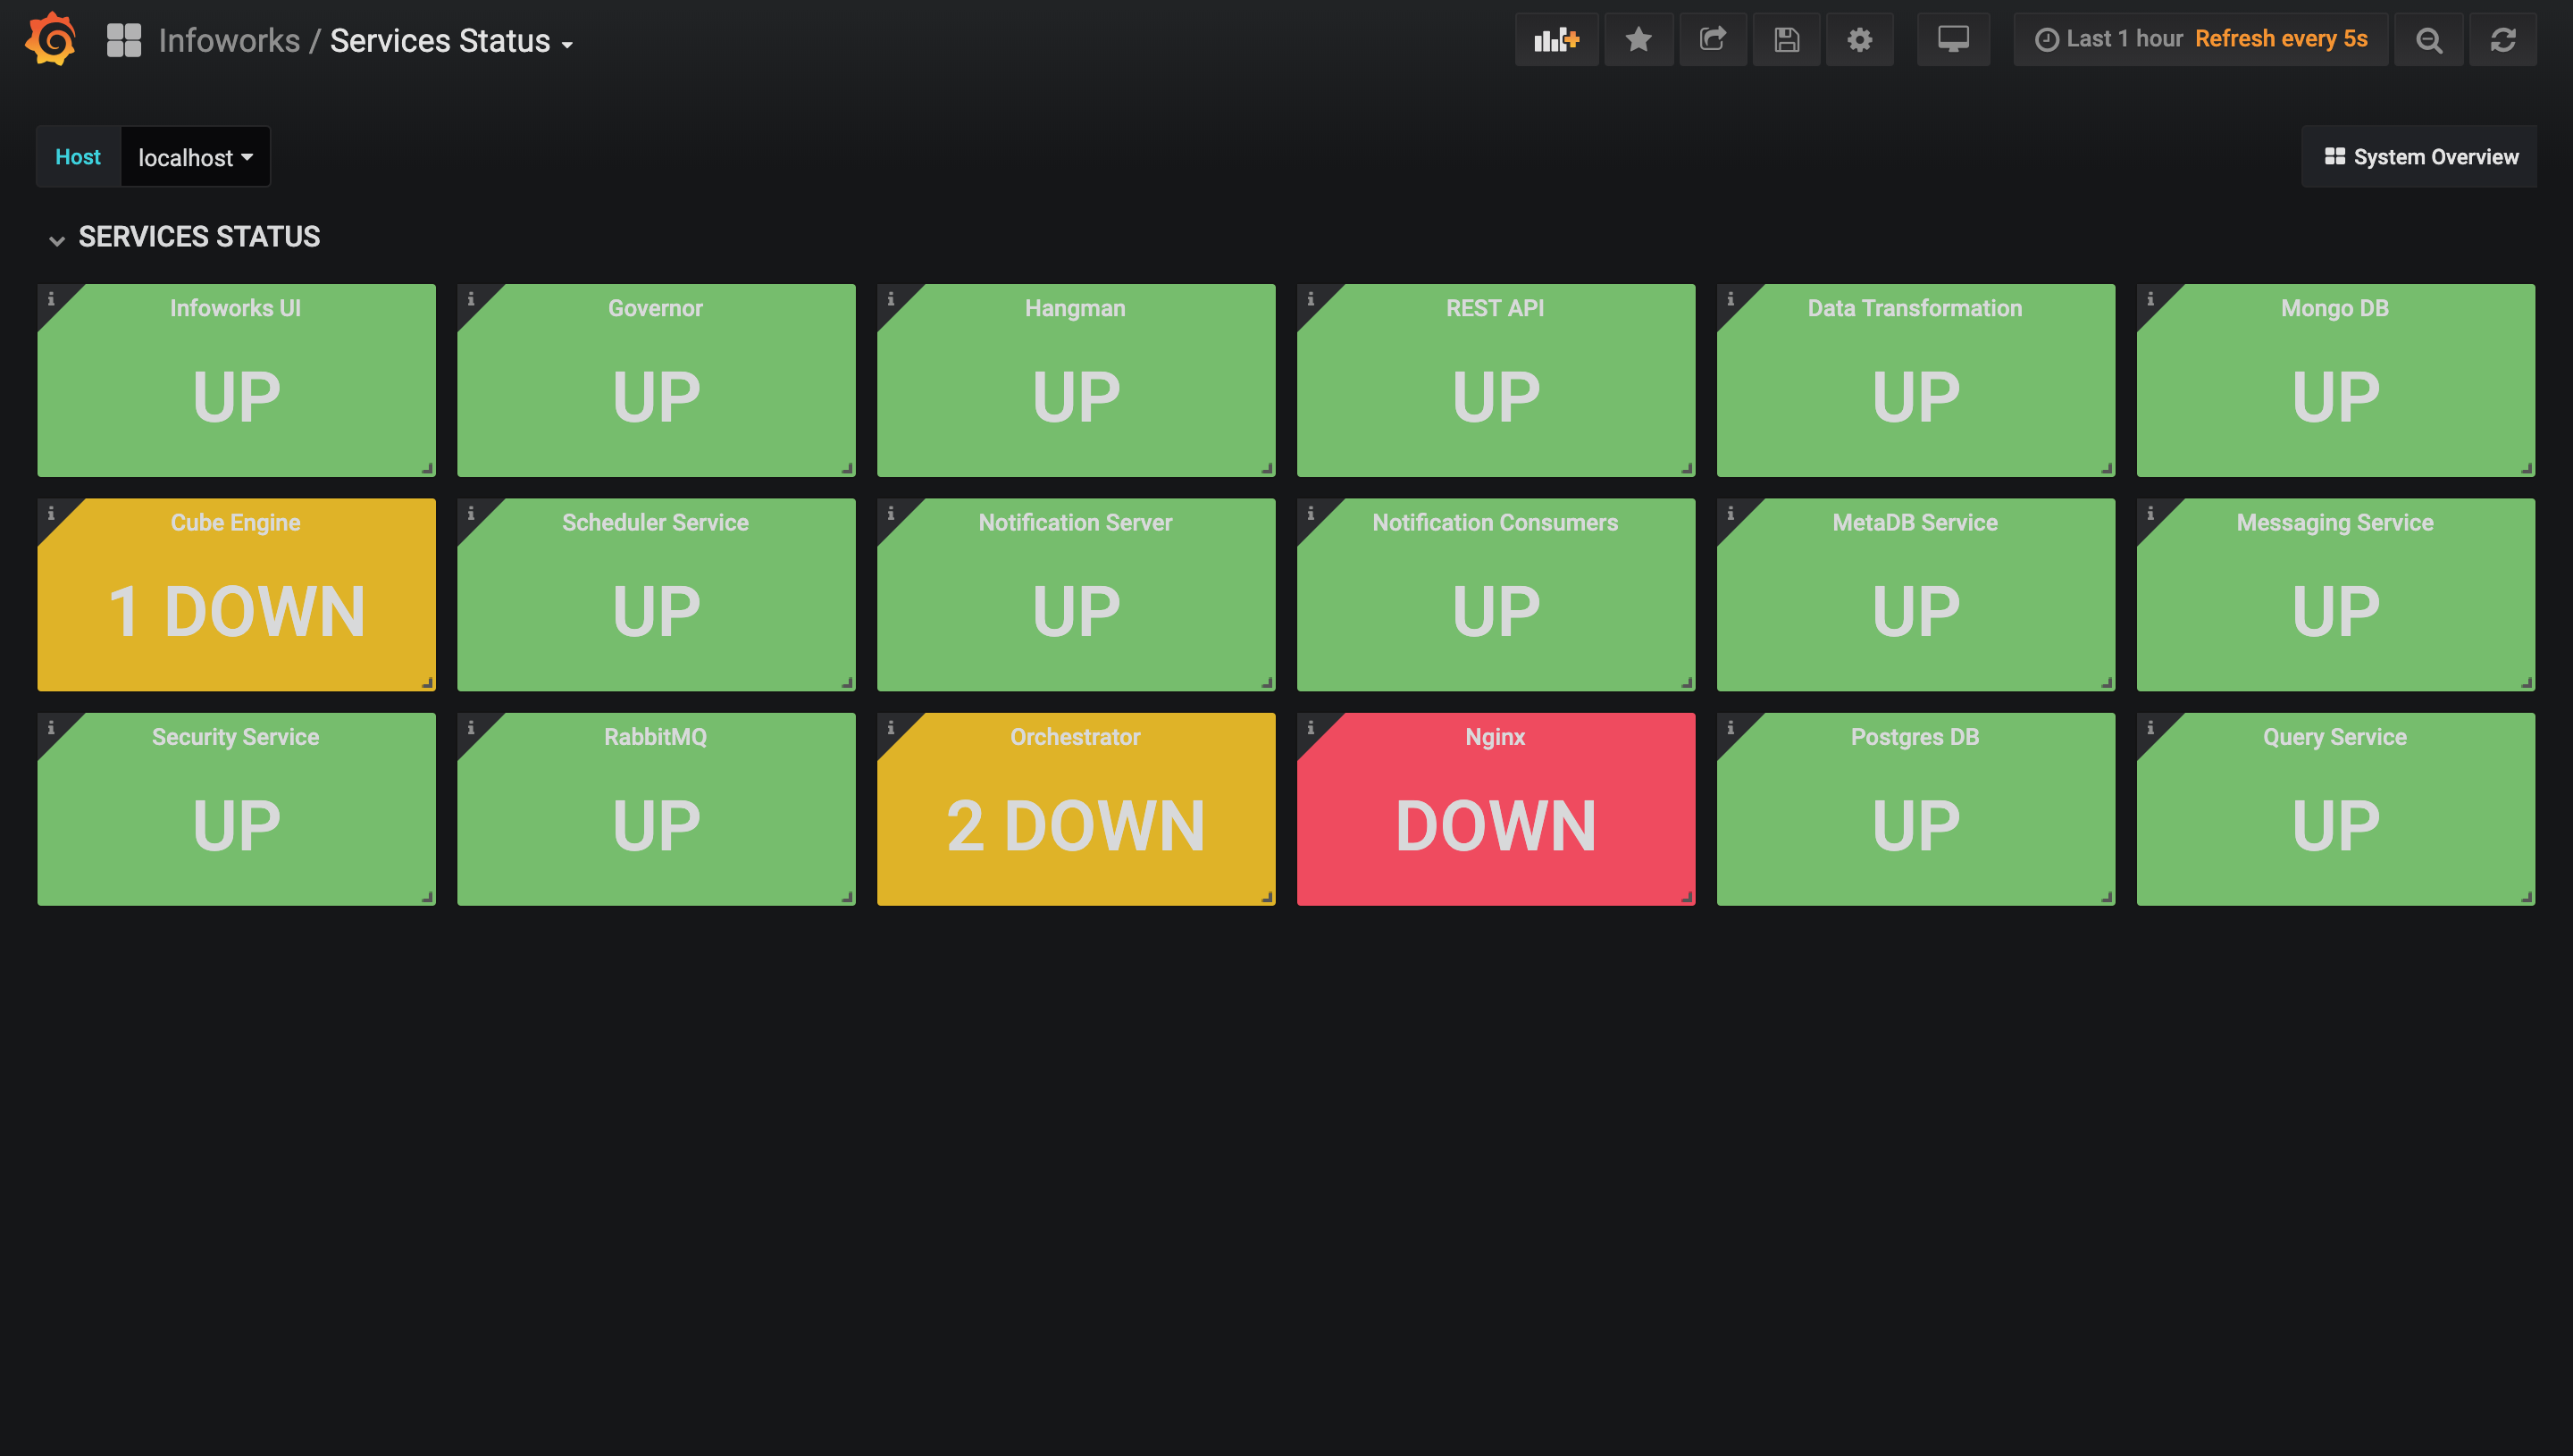
Infoworks Service Status Dashboard
This dashboard displays the status of the Infoworks services. To view the status, click the Service Status button from the home page.

Default Alert Rules
Following are the default alert rules:
- Service sends alerts when any Infoworks service is down.
- Service sends alerts if the monitoring data exporters are down. Data exporters are agents installed on the Infoworks edge nodes that collect metrics.
- Service sends alerts for high CPU, RAM and disk usage.
Running Monitoring Service Remotely
The monitoring service, by default, will be installed on the Infoworks edge node with the other Infoworks services. Monitoring service (server) can also be run on a remote node.
Following are the steps to run service on the remote node:
Perform the following on the remote node:
- Download iw_monitor.tar.gz, extract and copy to the $ IW_HOME/platform folder (create folder, if not present).
- Create IW_MONITOR environment variable using the following command:
export IW_MONITOR=$IW_HOME/platform/iw_monitor - Edit monitoring service conf.properties in the $ IW_MONITOR/bin folder and configure the edge_nodes key with all the edge node IPs.
- Navigate to $ IW_MONITOR/bin and run
configure.sh - Start the monitoring server using
$IW_MONITOR/bin/start.sh server
Perform the following on the edge nodes:
- Navigate to $ IW_MONITOR/bin and start data exporters using:
$IW_MONITOR/bin/start.sh exporters
NOTE: Do not start monitor service on any edge nodes. Check the status of the monitor service by running $IW_HOME/bin/status.sh and stop the service, if running.
- Access the monitoring dashboard from
http://<remote_node_ip>:<monitoring_server_port>
For more details, refer to our Knowledge Base and Best Practices!
For help, contact our support team!
(C) 2015-2022 Infoworks.io, Inc. and Confidential