Concept
Infoworks provides an Executive Dashboard to view activities within the Infoworks environment.
Questions such as “How many records are under management?”
“How many users are accessing the data for data engineering tasks?”
“What type of jobs are being executed?” and many other questions can be answered.
The Dashboard is the first screen displayed after login.
Login
- Open the Infoworks Autonomous Data Engine (ADE) application in a Chrome or Firefox browser by clicking on the link provided in your “Welcome to Infoworks” email.
- Enter the email and password provided in your “Welcome to Infoworks” email.
- Click the Dashboard tab.
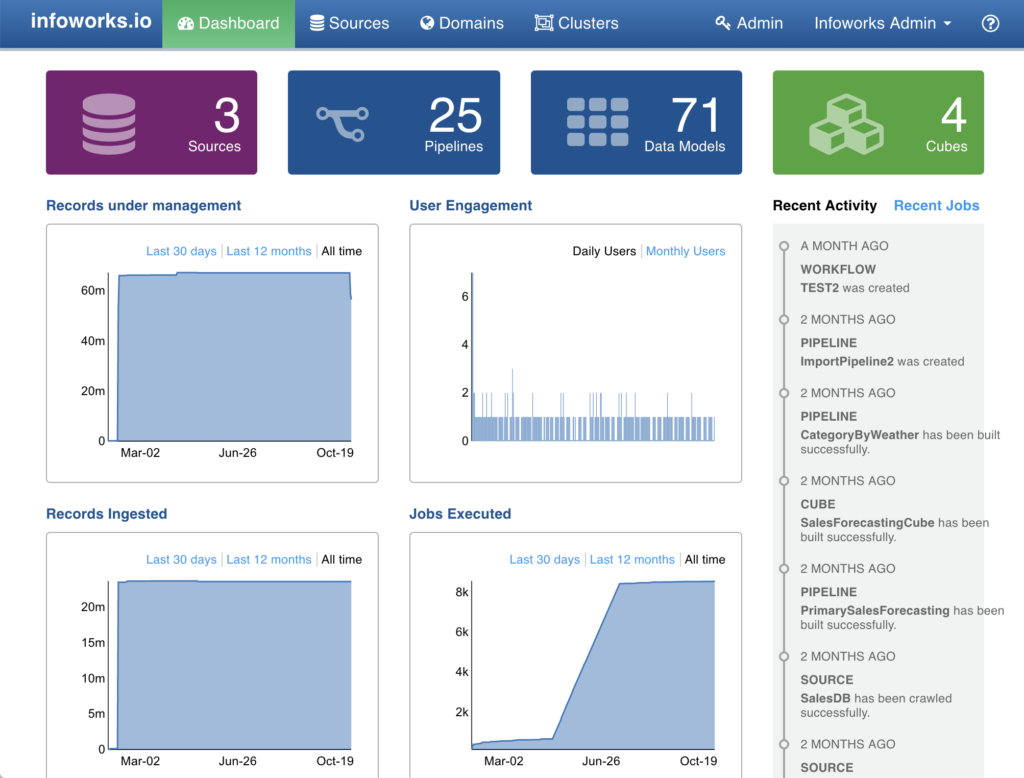
The Dashboard gives you a birds-eye view of the entire system - the number of sources, pipelines, data models, and cubes created within this environment.
It also provides stats on a few historical trends:
- number of records processed
- number of records ingested
- number of users accessing the system
- number of jobs executed