Title
Create new category
Edit page index title
Edit category
Edit link
Navigating DataFoundry
Infoworks DataFoundry home page consists of the following menu options on the menu bar:
- Dashboard
- Data Catalog
- Sources
- Domains
- Replicator
- Notifications
- Admin
- Login Settings
- Help Documentation
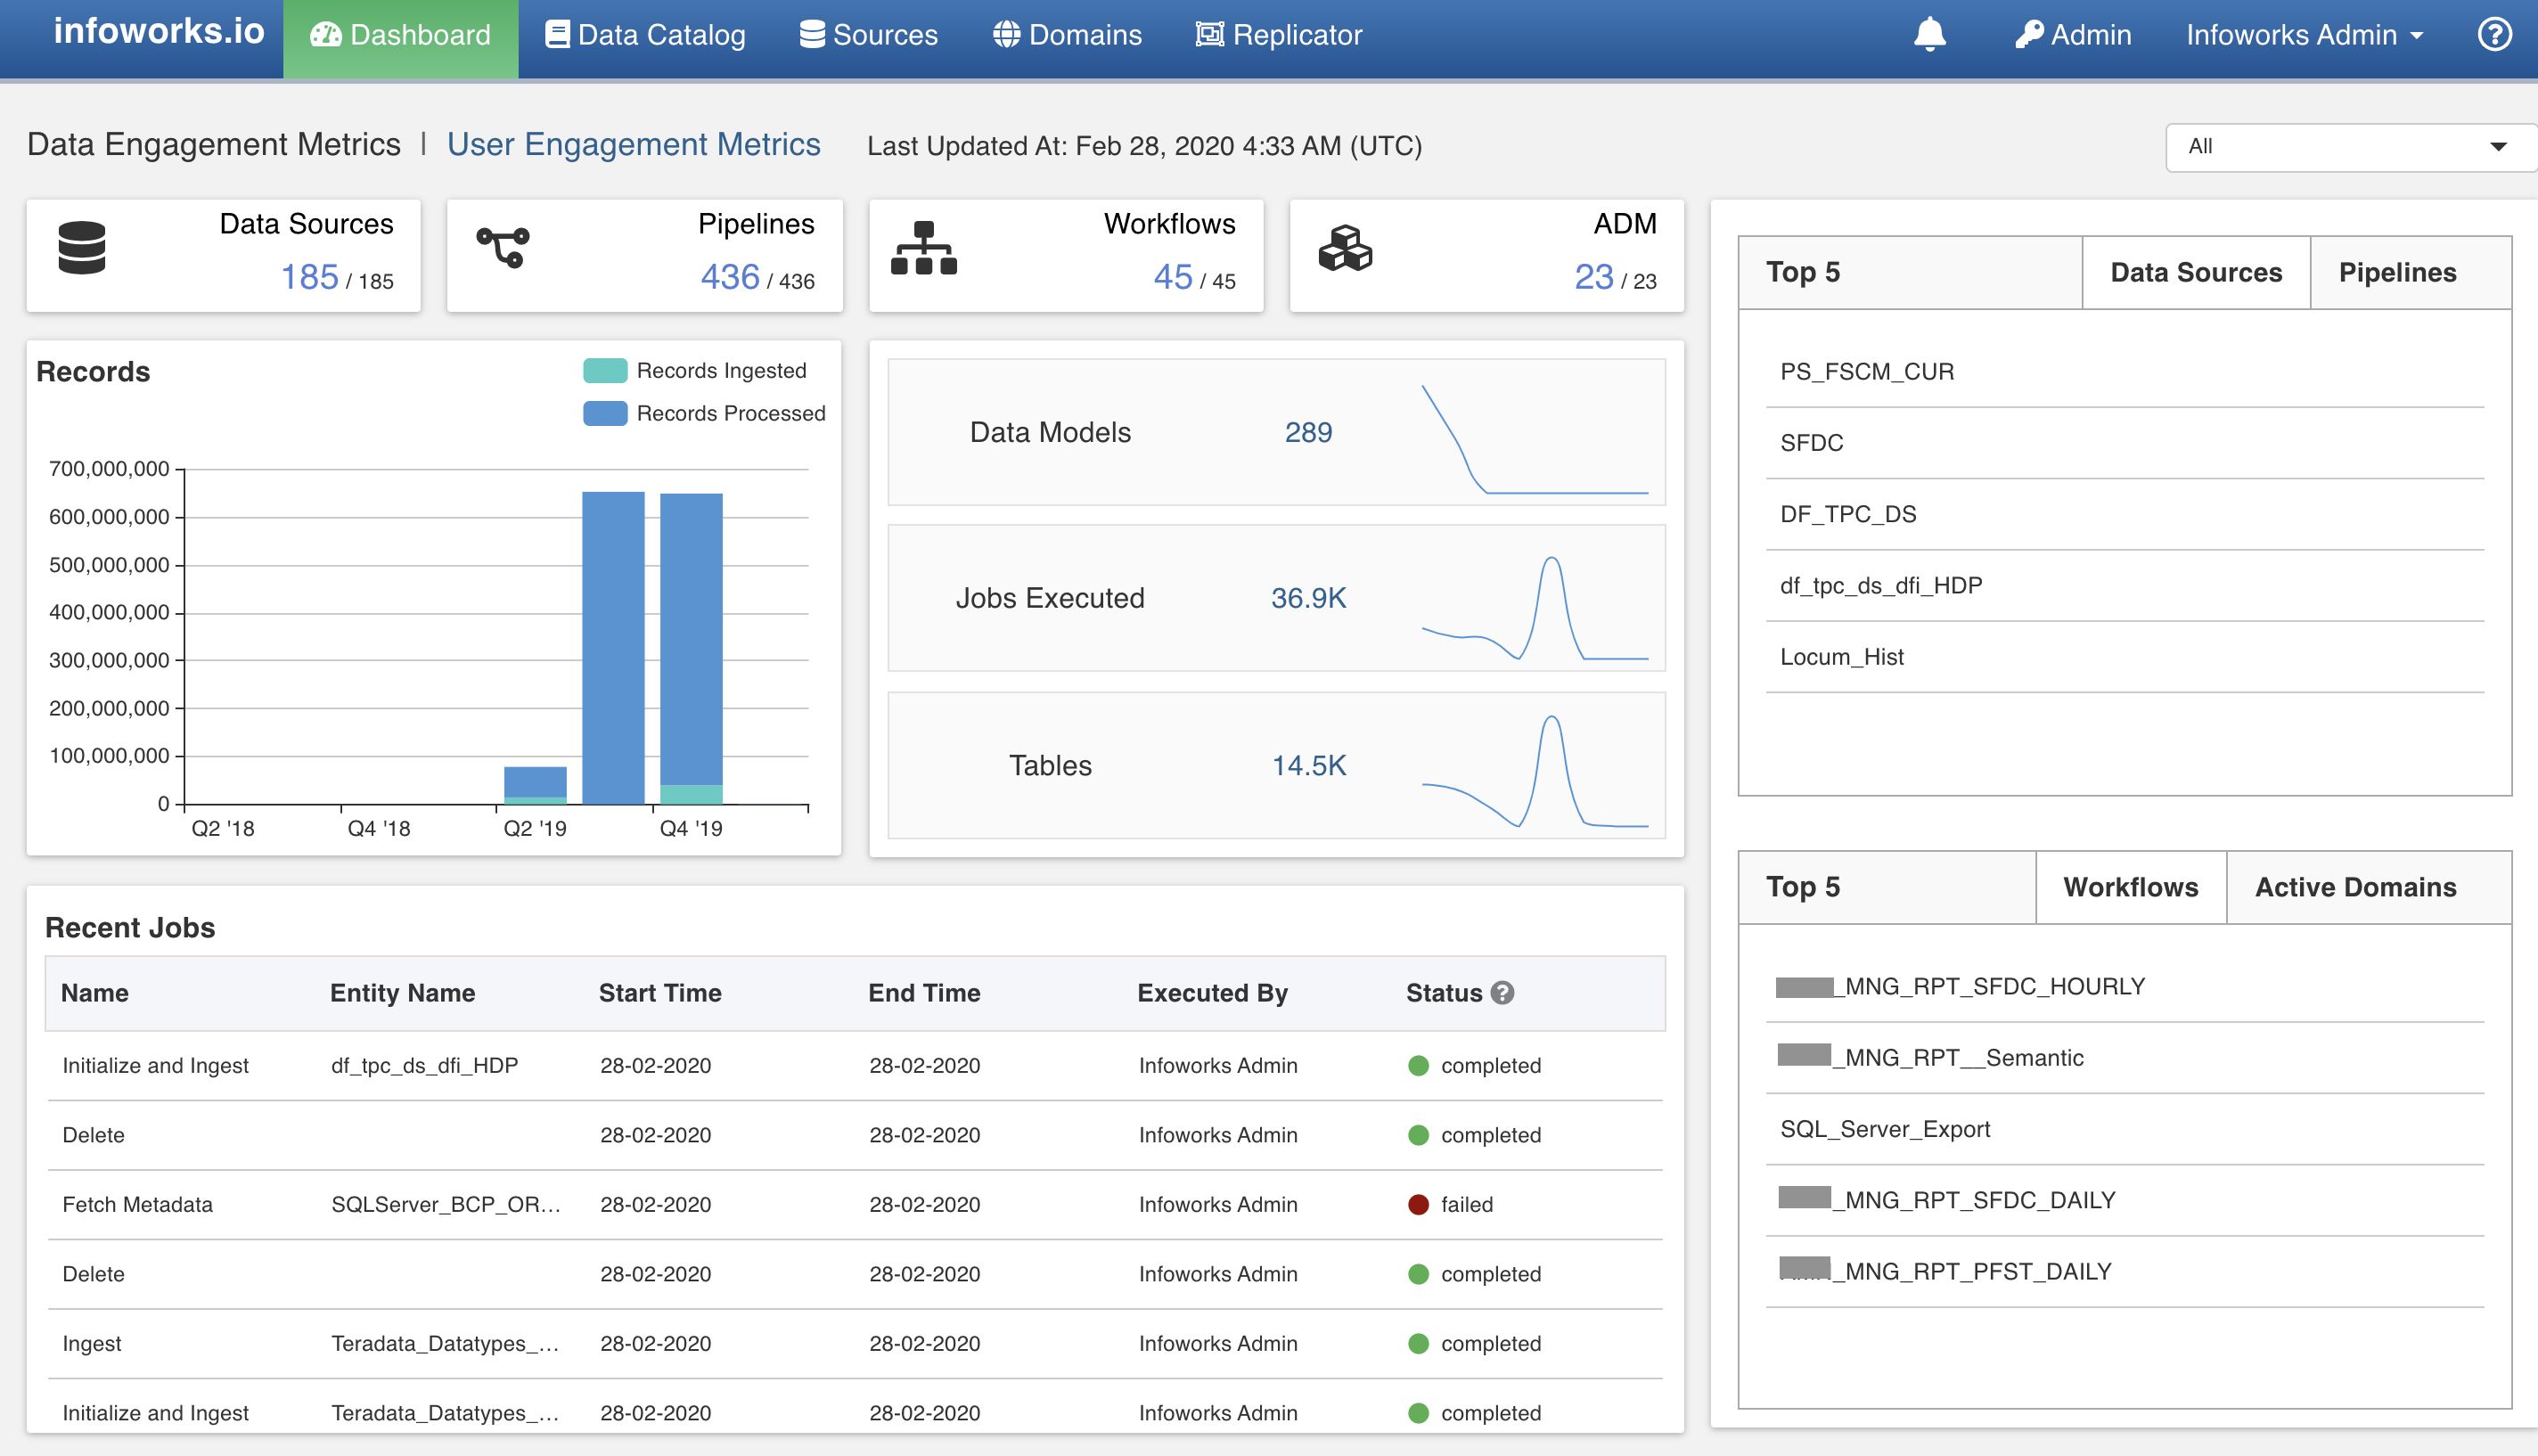
Following is the screenshot of the Infoworks DataFoundry home page:

Dashboard
The Engagement Dashboard displays the summary of key actions performed by the user on enterprise data. This provides a statistical framework to view and analyse data for better business performance. It also provides details on the engagement of users from different roles, with Infoworks DataFoundry.
Click Dashboard menu to view the Infoworks DataFoundry Engagement Dashboard.
The Infoworks DataFoundry Engagement Dashboard consists of two tabs:
Data Filter based on Duration: The tabs are enabled with a filter button on the top right corner to enable data filter based on the duration to be considered for data population. This also allows users to view an aggregated data for all artifacts, starting from the time Infoworks DataFoundry is being launched, using the All filter.
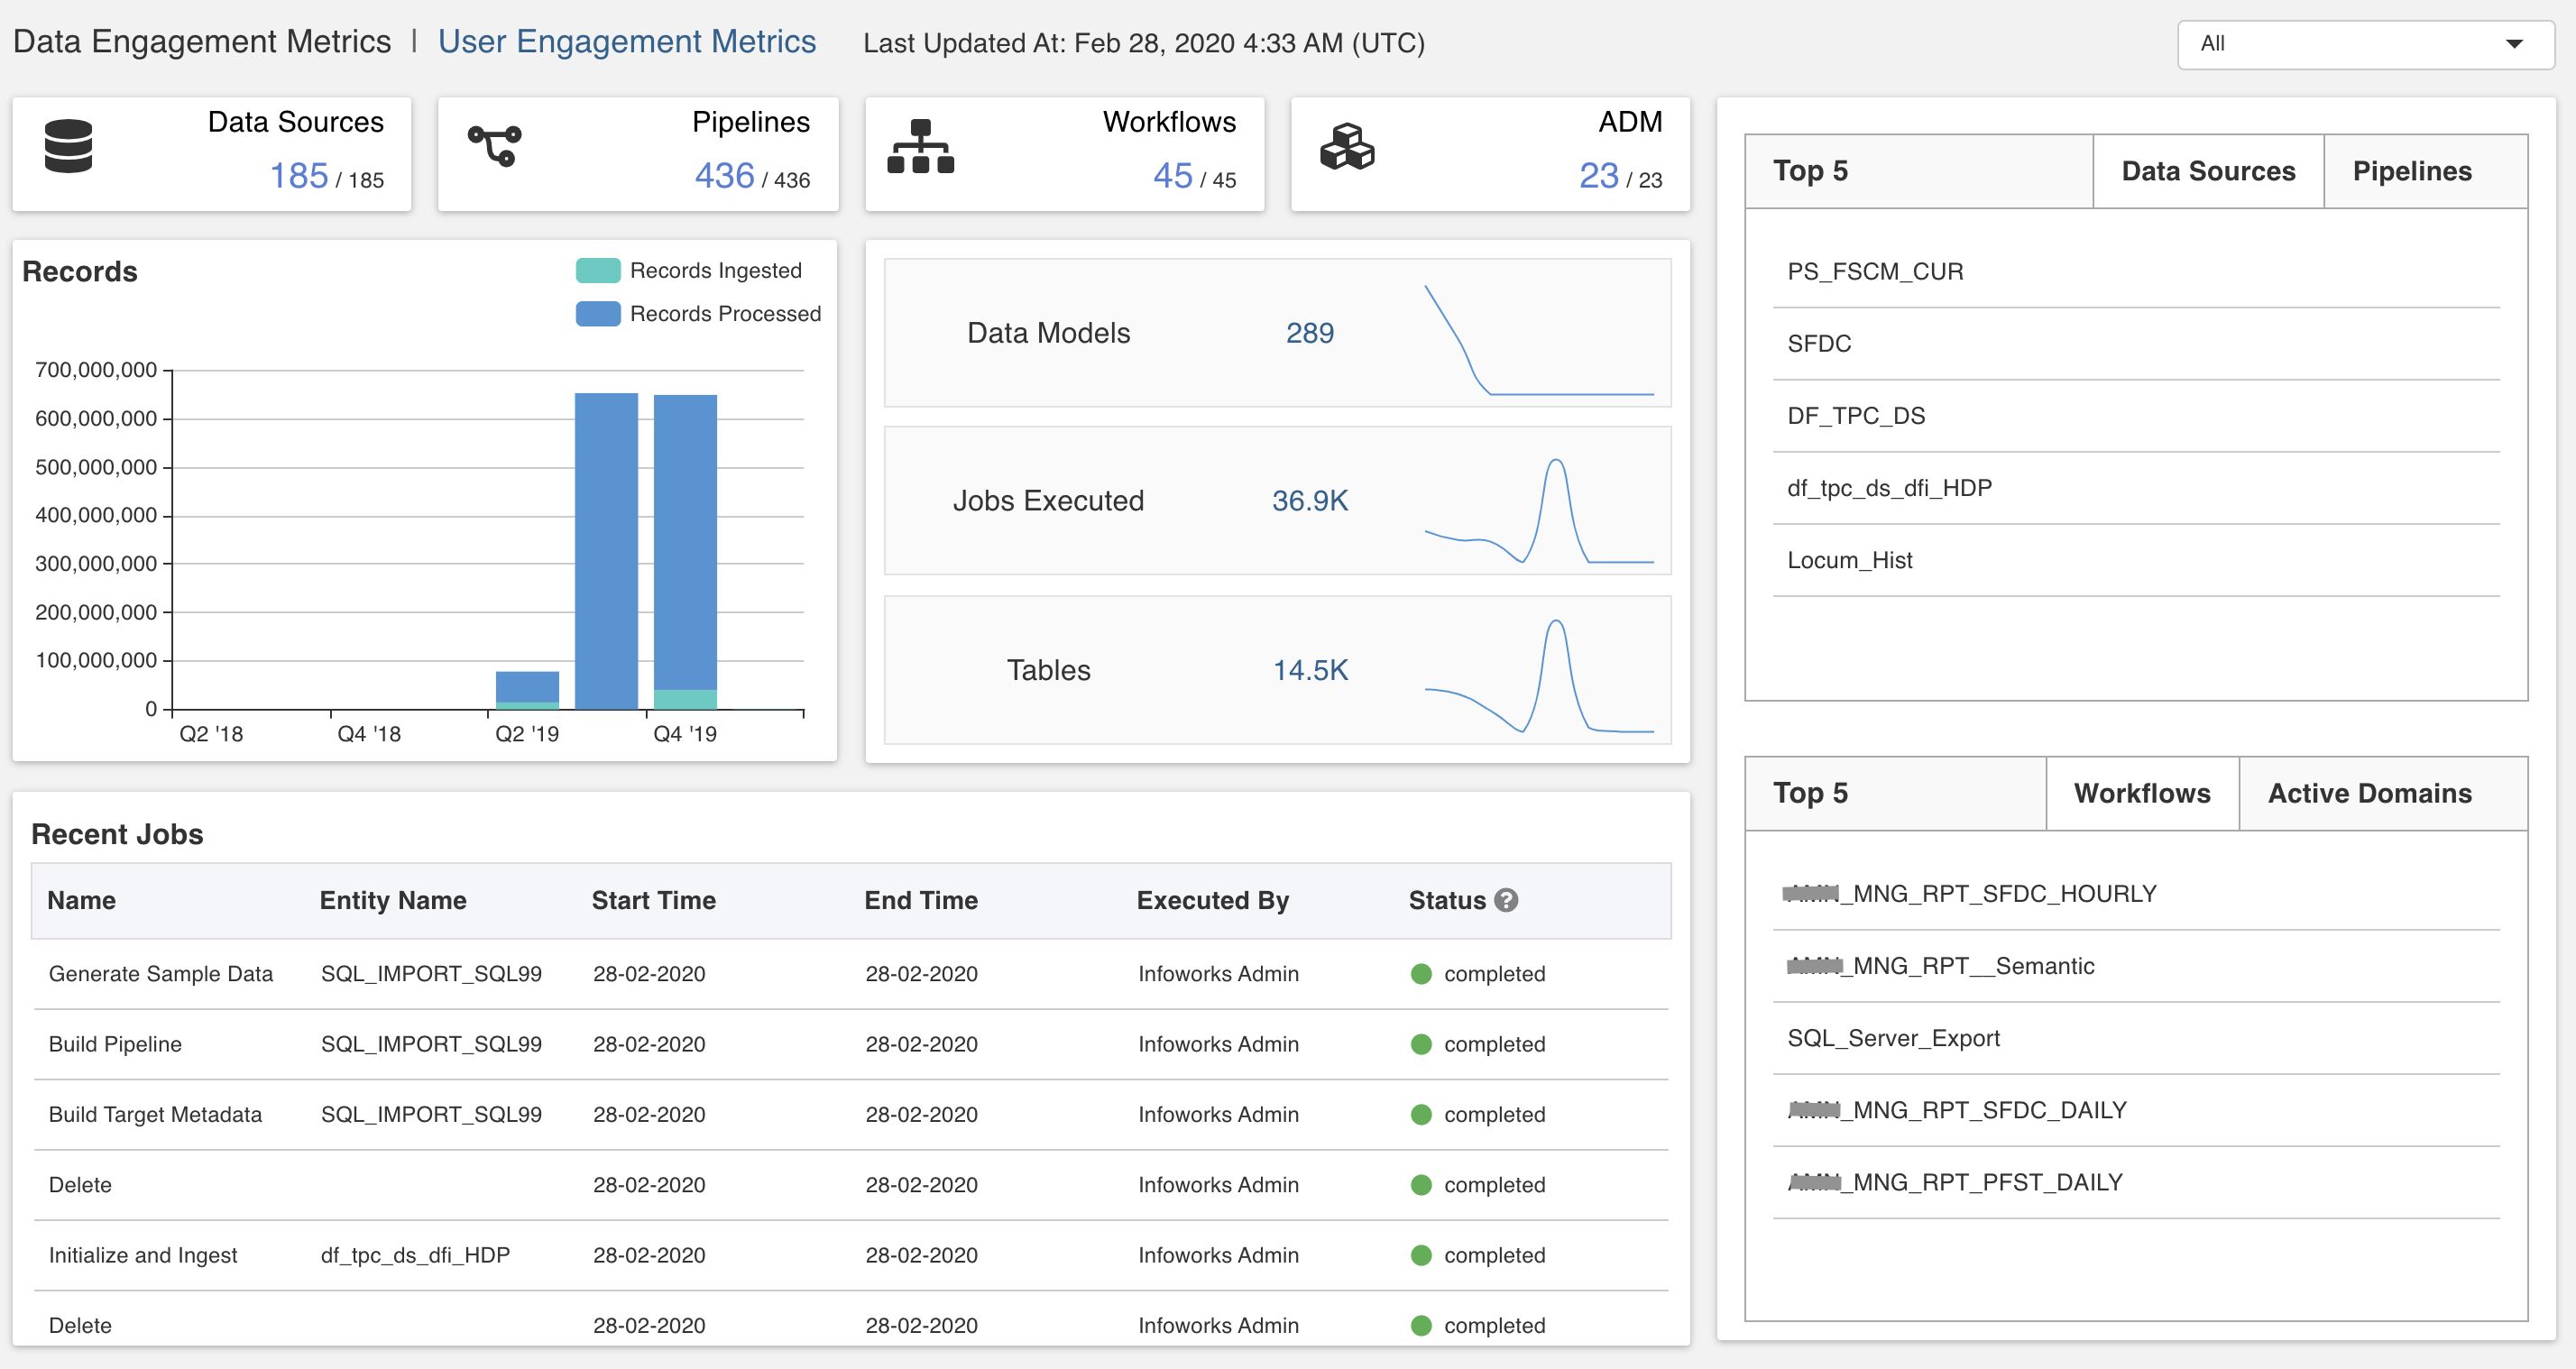
Data Engagement Metrics
This provides a visual representation of data statistics to view and analyse data parameters such as data sources, pipelines, workflows, and associated statuses.

The following table describes the Data Engagement Metrics items:
| Item | Description |
|---|---|
| Data Sources | Displays the number of data sources created by the user. For example: 47/67, where 47 is the number of data sources created in the selected duration, whereas 67 is the total number of data sources created since Infoworks DataFoundry has been launched. |
| Pipelines | Displays the number of pipelines created by the user. For example: 20/58, where 20 is the number of pipelines created in the selected duration, whereas 58 is the total number of pipelines created since Infoworks DataFoundry has been launched. |
| Workflows | Displays the number of workflows created by the user. For example: 40/49, where 40 is the number of workflows created in the selected duration, whereas 49 is the total number of workflows created since Infoworks DataFoundry has been launched. |
| ADM (Accelerated Data Models) | Displays the number of external pipeline targets (snowflake export). For example, 23/34, where 23 is the number of ADMs created in the selected duration, whereas 34 is the total number of ADMs created since Infoworks DataFoundry has been launched. |
| Records | Displays the records processed and records ingested. - Records Ingested: Total number of the full load and CDC records ingested. - Records Processed: Total number of ingested records which includes full load or ongoing CDC, records processed by each pipeline, and records processed by export jobs._ |
| Data Models | Displays the number of external pipeline targets (snowflake export). |
| Jobs Executed | Displays the number of jobs run per day (machine activity) which includes data ingestion pipeline jobs, number of tables ingested, data transformation pipelines, data model builds, orchestrator workflows processed, and export jobs. |
| Tables | Displays the number of data tables ingested. |
| Recent Jobs | Displays details of the latest twenty jobs, irrespective of their completion status, and belonging to all the users. |
| Top 5 | The following sections are available under the Top 5 tab: - Data Sources: Top five data sources based on the maximum number of pipelines or data exports driven. - Pipelines: Top five pipelines based on the number of times the pipelines are scheduled in a week to refresh data models. - Workflows: Top five workflows based on the number of schedules of the workflow in a week. - Active Domains: Top five active domains based on number of pipelines, models and workflows. |
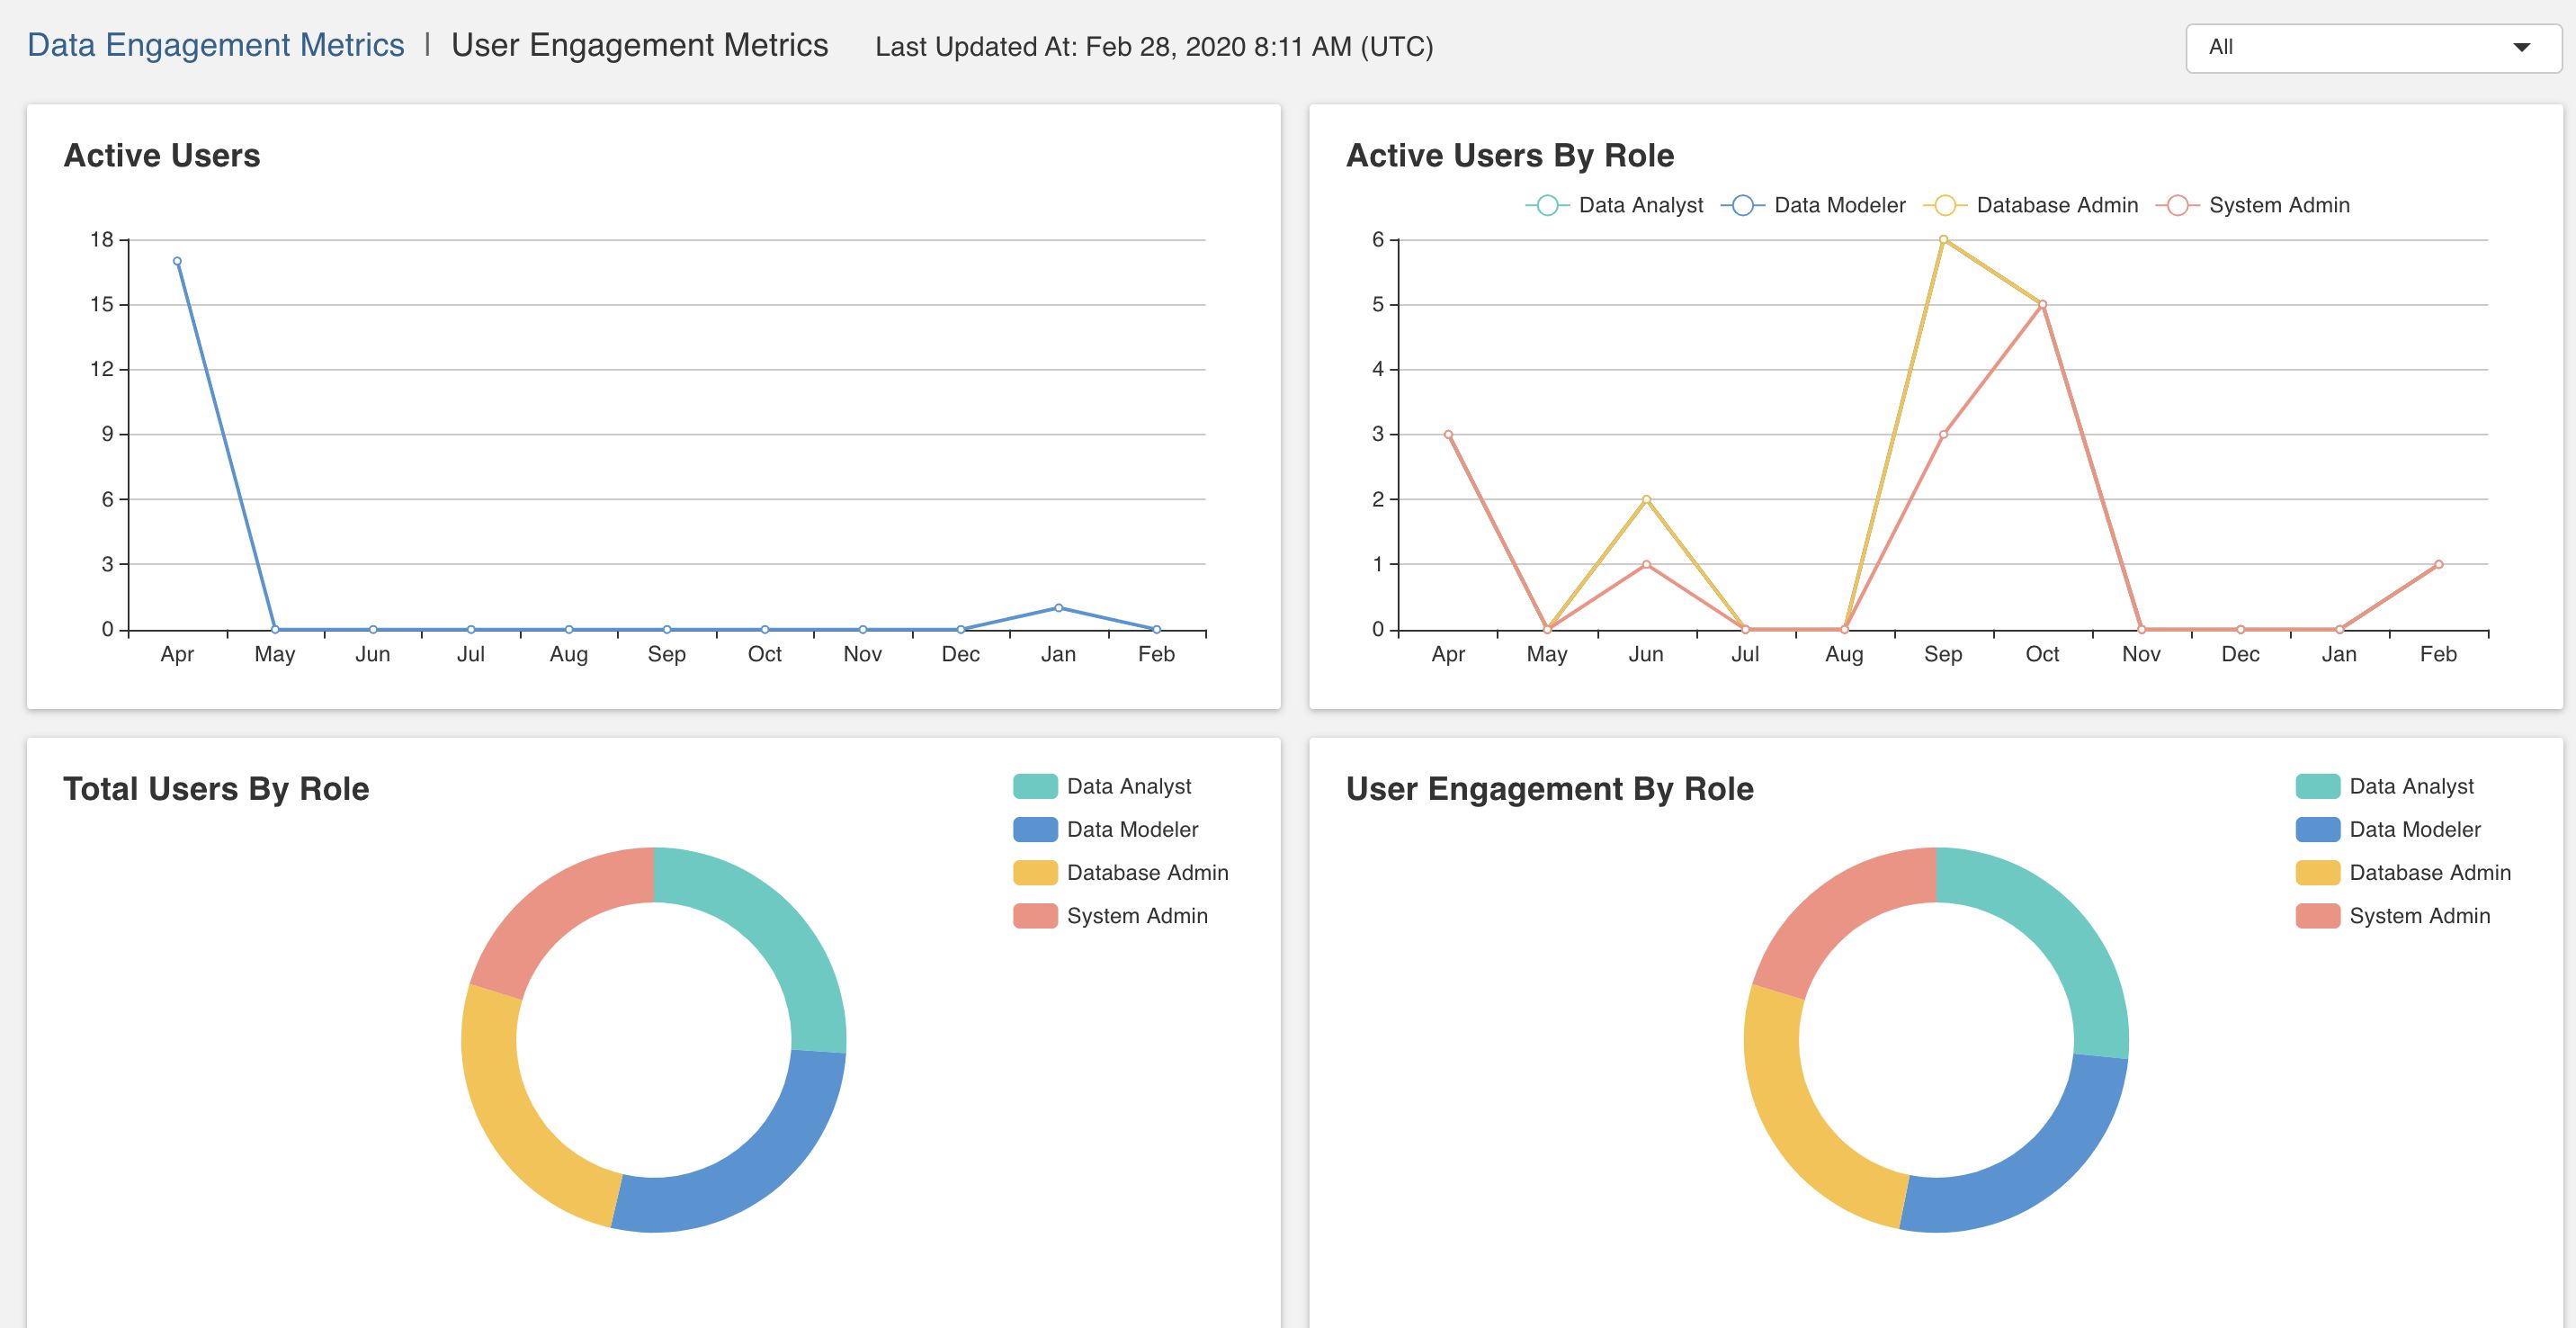
User Engagement Metrics
This provides details on the engagement of users on Infoworks DataFoundry such as number of active users, user roles and their associated usage statistics.
The following table describes the User Engagement Metrics items:

| Item | Description |
|---|---|
| Active Users | Displays users who have logged in to Infoworks DataFoundry atleast once in the selected duration. |
| Active Users by Role | Displays user roles which have logged in to Infoworks DataFoundry atleast once in the selected duration. |
| Total Users by Role | Displays present number of users available in the system based on user role. |
| User Engagement by Role | Displays engagement of different user roles in Infoworks DataFoundry. |
Data Catalog
Data Catalog enables you to search data in a single section regardless of access controls.
It display the following catalogs:
- all data sources that have been crawled, ingested and synchronized.
- all data pipeline targets that have been created using transformation pipelines.
For more details, see Data Catalog .
Sources
Sources menu displays the the list of all available sources in your Infoworks DataFoundry instance. For more details, see Managing Sources.
Domains
Domains menu displays the list of all available domains in your Infoworks DataFoundry instance. For more details, see Domain Management.
Replicator
Infoworks Replicator is a feature used for Hive Data Warehouse migration.This can be used to migrate the hive data and metadata to another cluster or cloud. It can also be used to keep two clusters in synchronization with respect to their hive data and metadata. It replicates data between HDFS and all cloud providers that implement the HDFS API to access their data.
For more details, see Data Replicator.
Notifications
The bell icon near the Admin menu displays all the job notifications. For more details, see Notifications.
Admin
Admin menu lists all the actions that can be carried out by an admin user (administrator). For more details, see Admin and Operations
Login Settings
The logged-in username is displayed as the Login Settings menu. This allows the user to navigate to user settings, or to log out of your Infoworks DataFoundry instance.
Help Documentation
The help icon allows the user to view the help content for respective screens.
For more details, refer to our Knowledge Base and Best Practices!
For help, contact our support team!
(C) 2015-2022 Infoworks.io, Inc. and Confidential